Story Maps and Dashboards
Within the links below, you will find various story maps and dashboards that highlight Commission activities, projects, and associated data.
To request information or data from the Commission, please see the Request for Information & Data page.
General Topics
SRBC's 50th Anniversary Celebration: 1971-2021 Story Map
A highlight of the Commission's first 50 years of landmark achievements, ongoing activities, and the people who have helped to make it all happen.
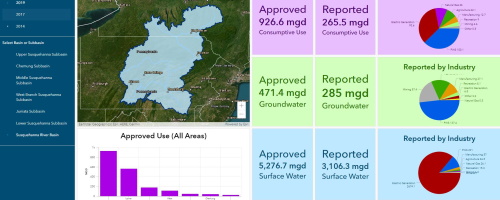
Track water use quantities throughout the Susquehanna River Basin in this dashboard. Approved and reported water use totals, as well as reported quantities by major industry, are available for each subbasin for the years 2014, 2017, 2019, and 2020.
Aquatic Species
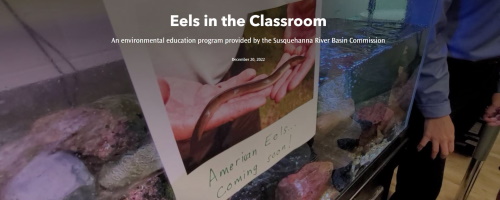
Eels in the Classroom Story Map
Learn about the Eels in the Classroom educational program that is provided by the Commission. This story map explains why migratory American Eels are important to the environment, how the program works, outlines teacher resources, and shares success stories.
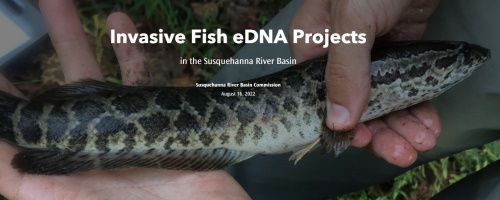
Invasive Fish eDNA Projects Story Map
See how the Commission has been using eDNA as a new monitoring tool to track aquatic invasive species such as blue catfish, northern snakehead, and round goby throughout the Susquehanna River Basin.
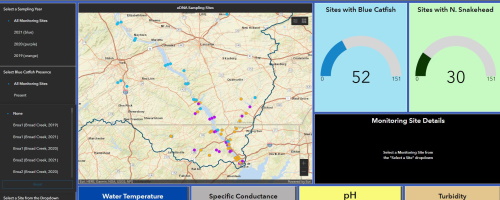
eDNA Monitoring Site Dashboard
Between 2019 and 2021, Commission staff performed eDNA analyses at stream sites throughout the Lower Susquehanna Subbasin. Interact with this dashboard to see when and where aquatic invasive species have been found.
Flooding
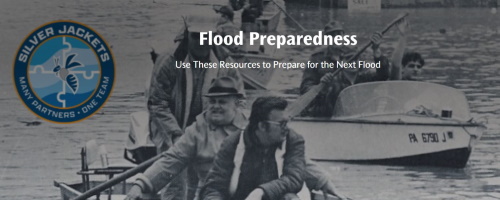
Recognizing the 50th Anniversary of Hurricane Agnes, the Commission, in partnership with Silver Jackets, developed this informational tool to facilitate preparation and planning for the next flood. Visit NOAA's Hurricane Agnes website to view other story maps related to Hurricane Agnes and advancements in flood risk reduction.
Mine Drainage
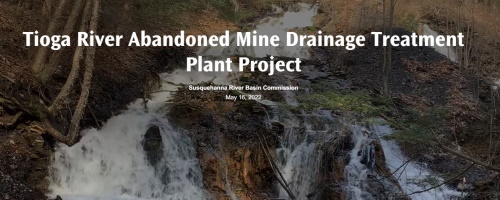
Tioga River Abandoned Mine Drainage Treatment Plant Project
The Commission and several partner agencies are in the design phase for an active treatment plant on Morris Run that will help restore over 20 miles of the Tioga River. Take a story map tour of the project and see the places that will benefit from this new initiative.
Water Quality
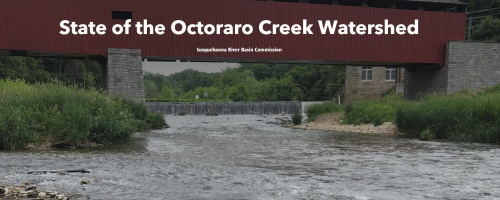
State of the Octoraro Creek Watershed Story Map
See results of data collected in the watershed as part of an Advanced Restoration Plan (ARP). This study examined water chemistry and benthic macroinvertebrate communities as indicators of stream health, providing scientists with baseline data to be used in future restoration efforts.
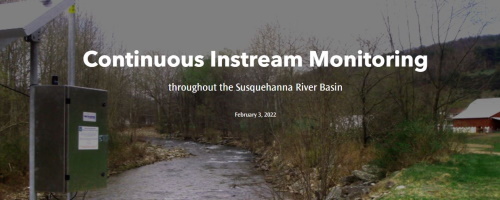
Continuous Instream Monitoring Story Map
Learn about the Commission's CIM Network. This network of monitoring stations across the Susquehanna River Basin transmits near real-time water quality data for parameters such as water temperature, specific conductivity, pH, turbidity, and dissolved oxygen.
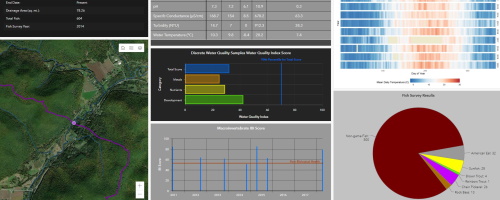
Continuous Instream Monitoring Station Dashboard
Investigate water quality data for each monitoring station in the Commission's CIM Network. Data are shown for water temperature, fish surveys, macroinvertebrate IBI scores, water quality index scores, and continuous parameter statistics.
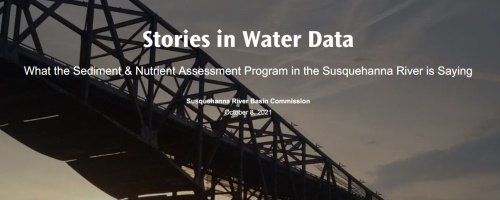
Stories in Water Data Story Map
This story map describes the Commission's Sediment & Nutrient Assessment Program (SNAP) that monitors water quality trends related to Chesapeake Bay pollution. Tracking trends helps to focus Chesapeake Bay restoration efforts and determine if conditions are improving.
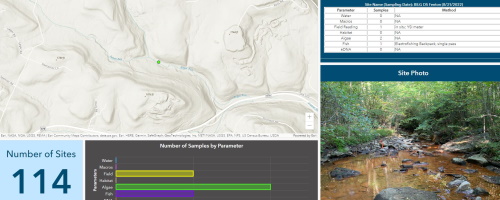
USEPA-Funded Water Quality Monitoring Sites Dashboard
Explore all of the water quality stream monitoring sites sampled by Commission scientists with CW 106 section funding. Various sampling details are provided for each site such as parameter collected, number of samples, sampling methodology, and site photos.
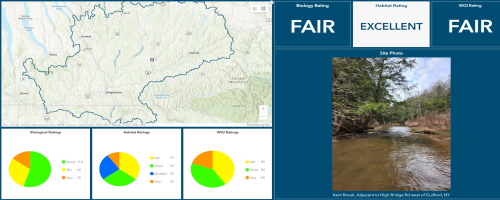
This dashboard shows the location of sites surveyed and their corresponding biology, habitat, and water quality ratings. The dataset begins with the Middle Susquehanna Subbasin in 2014 and is updated annually after new data have been collected and analyzed.