Water Quality Projects
These portals provide access to data and information on the water quality and habitat of rivers and streams in the Susquehanna Basin. The Commission's real-time Continuous In-stream Monitoring (CIM) network presents valuable water quality data with intense measurement frequency. Use the Mine Drainage Portal to explore sampling data in areas that have been affected by mining. The Sediment and Nutrient Assessment Program (SNAP) sampling network is part of the Chesapeake Bay Program and provides data on nitrogen, phosphorus, and sediment transport. The Water Quality and Biological Index Map interactively shows overall water quality and biological conditions throughout the Basin. These are interactive data-driven portals that include maps, tables, graphs and other functionality.
To request information or data from the Commission, please see the Request for Information & Data page.

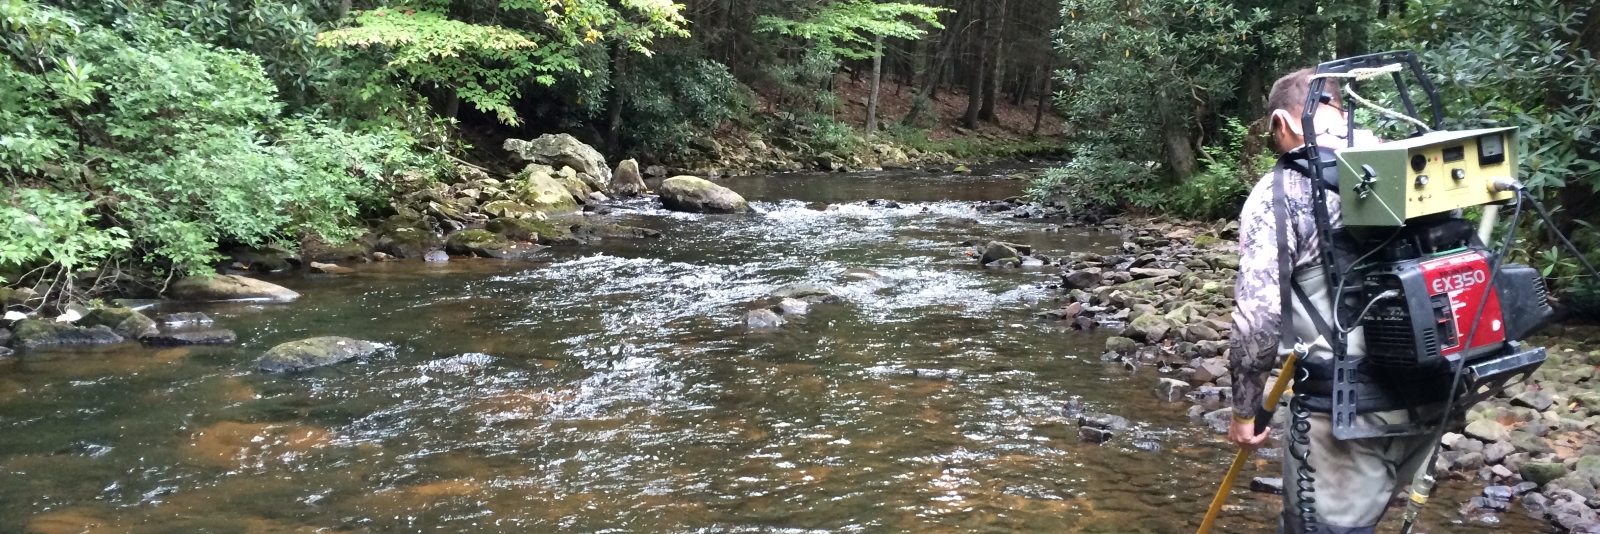
The Continuous Instream Monitoring (CIM) provides public, real-time water quality data from over 60 stations throughout the Susquehanna River Basin. The program uses instruments to measure water temperature, dissolved oxygen, pH, and other parameters. The program is unique because the stations remain in the same location for years, allowing for long-term studies. Scientists, policymakers, and the public use data to make decisions about water management, assess trends, and study cause-and-effect relationships.

The Mine Drainage Portal offers public access to data on the water quality impacts from mine drainage in the basin, including chemical data from various sources. Users can search for sampling locations and data, view a map of mine drainage sample locations and impaired streams, and submit mine drainage data. The Commission's Mine Drainage Program involves assessment, planning, design, and construction of abandoned mine drainage and abandoned mine land restoration projects to restore impaired stream miles and lands. More information on the Commission's mine drainage activities and specific projects can be found in the Reports Library.
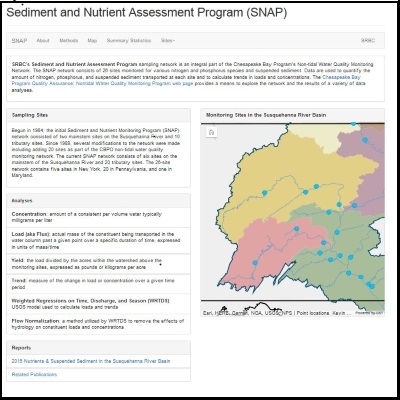
The Commissions's Sediment and Nutrient Assessment Program (SNAP) monitors 26 sites for nitrogen, phosphorus, and suspended sediment to calculate the amount transported at each site and to track trends. The SNAP network is part of the Chesapeake Bay Program's Non-tidal Water Quality Monitoring Network, and data analyses can be explored on an interactive map , or with charts and tables within the website. The network consists of six mainstem sites and 20 tributary sites across New York, Pennsylvania, and Maryland. Read more about Nutrients and Suspended Sediment int the Susquehanna River Basin.
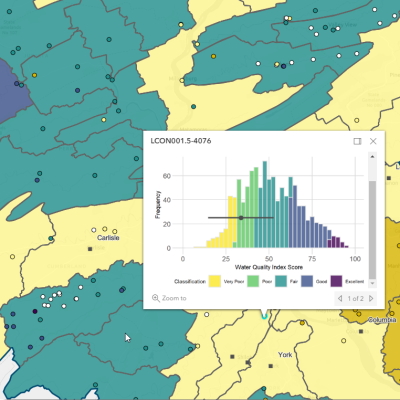
The Water Quality and Biological Index Map allow users to assess and compare water quality and biological conditions throughout the Susquehanna River Basin. The map is based on over 15,000 water samples collected from 2000-2019, using three category scores and an overall water quality score. The Biological Index Map uses the Chesapeake Bay basin-wide index of biotic integrity (Chessie BIBI) to score macroinvertebrate samples collected in the basin, displaying biological conditions for individual sites and watersheds. Users can toggle layers, zoom to watersheds, and click on sample locations for additional information.
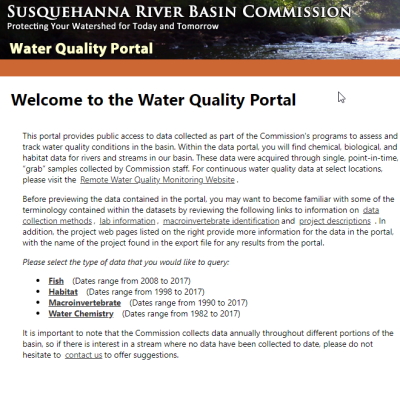
The Water Quality Portal provides public access to water quality data for rivers and streams in the Susquehanna River Basin collected by Commission staff through single, point-in-time "grab" samples. The portal contains chemical, biological, and habitat data. Data types available for query include fish, habitat, macroinvertebrate, and water chemistry, with dates ranging from 1982 to 2017.