Frequently Asked Questions
Answer: The sustained monitoring of key variables is the benchmark to assess and answer important questions about environmental change.
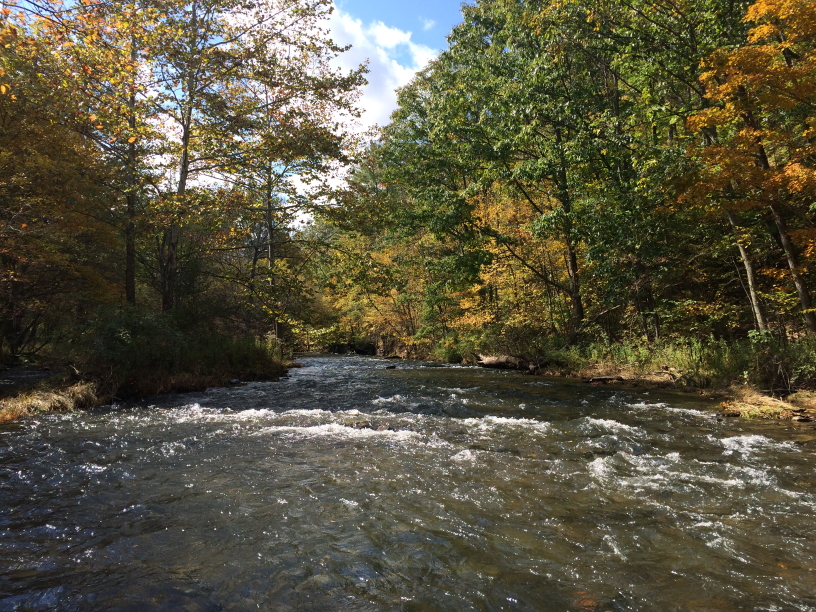
Making policy and management decisions with limited or insufficient data leads to costly and perhaps irreversible mistakes. Historically, rigorous scientific data seldom have been collected at river basin scales anywhere in the world. With all of its environmental measurement programs, the Commission strives to improve and enhance our efforts in order to make well-informed policy and management choices. In 2003, the Commission began to use Continuous Instream Monitoring (CIM) technology to measure water quality indicators in support of major potable water supply operations along the Susquehanna’s mainstem rivers. In 2009, the Commission vastly expanded its use of CIM technology and deployed equipment into streams and smaller rivers in response to the rapid influx of unconventional natural gas operations. Today, the Commission’s real-time CIM network includes approximately 70 active stations distributed throughout the entire Susquehanna River watershed. To support a variety of stakeholder needs and interests as well as focused internal research, the Commission also operates 10 to 20 CIM stations without the real-time data feed.
Wherever possible, the Commission is committed to long-term monitoring activities because many stream conditions change slowly. Years-long measurement records are needed in order to know whether an observation is unusual or extreme. Long-term monitoring records also give context to short-term studies and events. Good foresight in design and high-quality collection standards combined with careful interpretation of results ensures that the value of data last far into the future.
Question: What is SRBC's Continuous Instream Monitoring (CIM) network?
Answer: CIM is a system of continuous monitoring stations designed to remotely track water quality conditions in the Susquehanna basin. The network provides data for water management agencies to determine whether man-made activities are impacting water quality in the Susquehanna River Basin.
Question: Why did SRBC start the network?
Answer: SRBC’s CIM network is the combination of two monitoring efforts, the Early Warning System (EWS) and Remote Water Quality Monitoring Network (RWQMN). The EWS was initiated in 2003 to help protect and manage public drinking water sources on major river systems. The RWQMN was launched in 2010 due to increased demands for water, particularly for natural gas drilling, coupled with the increasing potential for wastewater spills require advanced technology to monitor rapid changes in water quality conditions. The data help agency officials track existing water quality conditions and any changes in them on an ongoing, real-time basis.
Question: Where are the stations located?
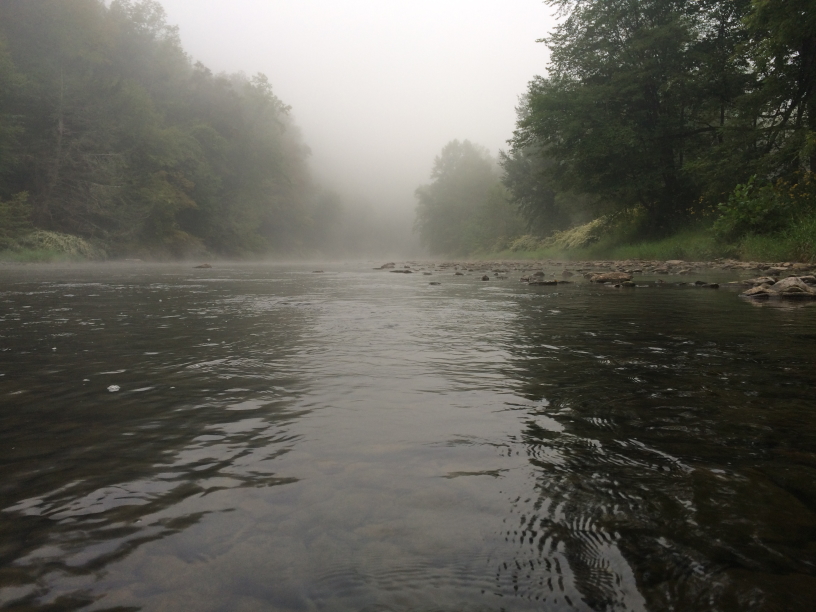
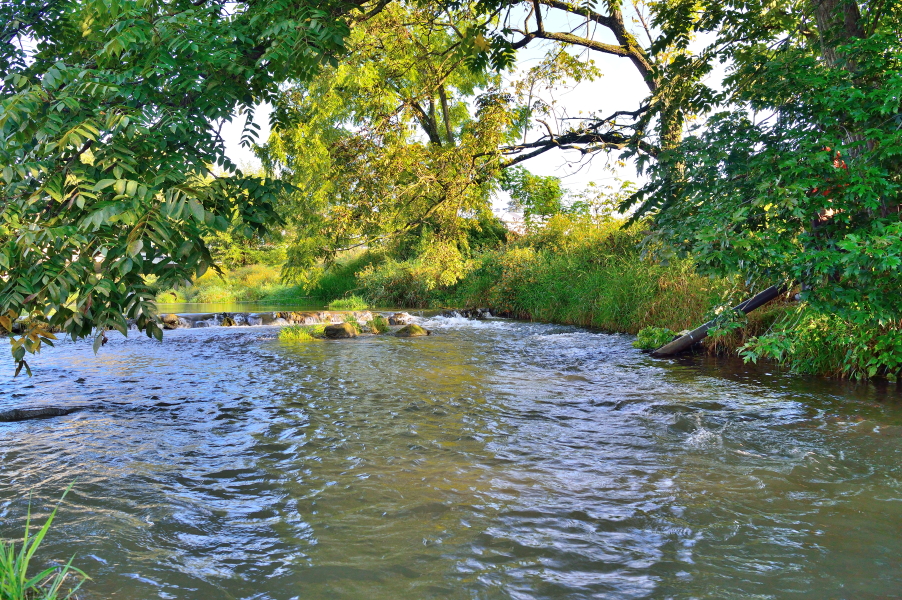
Answer: The stations are located throughout the New York and Pennsylvania portions of the Susquehanna River Basin on both major rivers and smaller tributaries. Currently, there are 76 water quality monitoring stations.
Question: How is SRBC selecting station locations?
Answer: SRBC selects monitoring sites based on various criteria, including: (1) human activities within the watershed; (2) watersheds match criteria such as stream size, streamflows, etc.; and (3) based on interest from government agencies, nonprofits, and the general public. SRBC also selects some locations specifically for their pristine qualities such as those designated as High Quality or Exceptional Value Streams, or streams critical to drinking water supplies.
Question: What types of monitoring are conducted?
Answer: The majority of the monitoring stations are equipped with sensors that can detect subtle changes in water temperature, pH, dissolved oxygen, conductivity (ability to conduct electricity), and turbidity (water clarity).
Question: Does SRBC collect additional data during station visits?
Answer: Yes. At select stations, SRBC also collects:
- streamflow measurements
- fish collection
- macroinvertebrate (bugs) and habitat data
- discrete grab samples for Alkalinity, Aluminum, Chloride, Barium, Total Dissolved Solids, Sulfate, Total Organic Carbon, Calcium, Magnesium, Sodium, Potassium, Nitrate, Bromide, Strontium, Total Phosphorus, Iron, and Manganese
Question: How does the network operate?
Answer: The monitoring network provides constant data measurement with instruments sensitive enough to detect subtle changes in water quality on a frequency that will allow background conditions and any changes to them to be documented throughout the year. SRBC receives the data from the stations and makes that real-time information available to resource agencies and the public on the CIM Website.
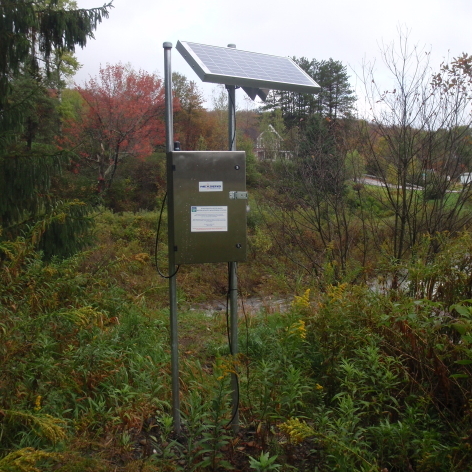
Question: What does a CIM station look like?
Answer: Each station consists of a:
Understanding Monitoring Parameters
Question: What do the monitoring parameters measure and why are they important?
Answer
Temperature - measures how warm or cold a stream runs over time. Temperature can affect the general health of aquatic organisms and the ability of water to hold oxygen as well as the ability of organisms to resist certain pollutants.
pH - measures the stream's acidity or alkalinity, with normal ranges between 6 and 9. Pollution can change the pH of water, which in turn can harm animals and plants living in the water.
Specific Conductance - measures the ability of the water to conduct electricity, which typically reflects the amount of dissolved solids or chlorides in the water. High specific conductance indicates high dissolved-solids concentration; dissolved solids can affect the suitability of water for domestic, industrial, and agricultural uses. The primary parameter of interest in areas of natural gas drilling will be conductivity, since this is the parameter most likely to rise if natural gas development activities impact local streams.
Dissolved oxygen - measures the amount of oxygen in the water available to aquatic life, with levels best above 4-5 milligrams per liter. The oxygen dissolved in streams is crucial for the organisms and creatures living in it. As the amount of dissolved oxygen drops below normal levels in waterbodies, the water quality is harmed and creatures begin to die off.
Turbidity - measures water clarity, or the amount of particulate matter in the water column. Turbidity is measured by shining a light through the water and is reported in nephelometric turbidity units (NTU). During periods of low flow (base flow), turbidities are low, usually less than 10 NTU. Higher turbidity readings, typical during storm events or resulting from pollution, can make the water cloudy or opaque and can block sunlight needed by aquatic organisms. Streams with persistently high turbidities can degrade aquatic habitat and pose difficulties for the treatment of drinking water.
Question: At what interval are the data measured?
Answer: The water quality parameters are measured at 15-minute intervals and the data are transmitted to the SRBC office in Harrisburg every 2-4 hours. During the winter season, data transmission schedules to the website may be reduced for select stations to conserve power, since the stations are powered by solar panels, which can be affected by snow/ice conditions and shorter daylight hours. In addition, water quality observations may be affected at times by ice build-up and/or blockages.
Access and Use of Data
Question: Does SRBC monitor the water quality data coming into the office?
Answer: Yes, SRBC staff members monitor the continuous monitoring data. In addition, alarms are set for each parameter at each station to alert SRBC staff of any deviations from normal levels.
Question: How are the data used?
Answer: The network provides early warnings to help environmental protection officials respond more rapidly and better pinpoint causes if water quality conditions change. Additionally, many organizations and the public use the data to simply monitor the quality of streams. The data are also being used by local universities working on watershed research.
Question: What is the difference between provisional and approved data?
Answer: Uncertainty and potential for error can be associated with environmental monitoring data. Provisional data have not been subject to a quality assurance process, but rather are the raw data reported by the instrument. Data users are cautioned to consider carefully the provisional nature of the information before using it for decisions that concern personal or public safety or the conduct of business that involves substantial monetary or operational consequences.
Approved data are currently available by request by emailing: [email protected]. Approved data have been subject to a quality assurance process to correct for equipment or fouling drift. Data recorded during equipment malfunctions have been removed.
View Historical Stations that have been discontinued.
Cost
Question: How much does each monitoring station cost?
Answer: It costs about $25,000 to purchase and install the equipment, and about $12,000 annually to maintain each station. This annual maintenance cost includes labor, equipment servicing, and data management.
Question: How is the network funded?
Answer: Initial funding for the RWQMN was provided from several sources: East Resources, Inc., the New York State Energy and Research Development Authority, and the Headwaters RC & D Council Sinnemahoning Stakeholders Committee. Additional funding was provided by the Pennsylvania Department of Conservation and Natural Resources (DCNR) for stations to be installed on state forest lands and Chesapeake Energy funding was used to enhance the program. For several years, DCNR provided funding for O&M for stations on state forest lands. Currently, SRBC is covering the continuous operation and maintenance costs for the network.
The EWS system was initially funded by the Pennsylvania Department of Environmental Protection and in-kind support from drinking water suppliers. Subsequent funding has been provided by the Environmental Protection Agency to continue O&M at several of the locations. Sites that are only hosted by SRBC are funded by the water supplier.